AppSignal Integration
Send browser reports to AppSignal for centralized error tracking alongside your backend errors.
The AppSignal integration forwards W3C browser reports to AppSignal's error tracking, giving you a unified view of both frontend and backend issues. Browser reports appear as errors in your AppSignal dashboard, complete with report details and a link back to the full report in the Reporting API App.
Prerequisites
Before setting up the AppSignal integration, you'll need:
- An AppSignal account — Sign up for AppSignal if you don't have one
- A Front-end error monitoring API key — This is different from your backend Push API key
- A Reporting API App application — With reports already flowing (see Getting Started)
Getting Your AppSignal API Key
To find your Front-end error monitoring API key:
- Log in to your AppSignal dashboard
- Select your application
- Navigate to App settings (gear icon)
- Click Push and deploy in the sidebar
- Find the Front-end error monitoring section
- Copy the API key shown there
Configuration
Step 1: Open Your Application Settings
In the Reporting API App, navigate to your application and click Edit to open the application settings. Scroll down to the Integrations section.
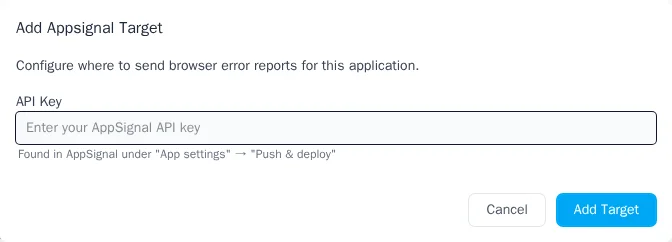
Step 2: Add AppSignal Integration
Click Add AppSignal to create a new AppSignal notification target. Enter your Front-end error monitoring API key in the form.
00000000-0000-0000-0000-000000000000
Your API key is encrypted at rest and never exposed in logs or the UI after saving.
Step 3: Configure Namespace (Optional)
By default, browser reports appear in the frontend namespace in AppSignal. You can customize this to
organize errors differently:
frontend— Default namespace for browser errorsweb— Group with your web application errors- Custom value — Any string to create a dedicated namespace
Namespaces help you filter and organize errors in AppSignal's dashboard. Choose a namespace that fits your team's workflow.
Step 4: Enable the Integration
After saving, ensure the integration is enabled. You can toggle integrations on and off without losing your configuration.
How Reports Appear in AppSignal
When a browser report arrives, Reporting API App transforms it into an AppSignal error format and sends it to AppSignal's public endpoint.
Error Name Mapping
Browser report types are mapped to descriptive error names in AppSignal:
| Report Type | AppSignal Error Name |
|---|---|
csp-violation |
CSPViolation |
deprecation |
DeprecationWarning |
intervention |
BrowserIntervention |
integrity-violation |
IntegrityViolation |
| Other types |
TitleCased version (e.g., crash-report → CrashReport)
|
Payload Structure
Each report is sent to AppSignal with the following structure:
{
  "namespace": "frontend",
  "timestamp": 1734012345,
  "error": {
    "name": "CSPViolation",
    "message": "{ full report body as JSON }"
  },
  "tags": {
    "report_type": "csp-violation",
    "report_url": "https://reporting-api.app/organizations/.../reports/..."
  }
}
Payload Fields
| Field | Description |
|---|---|
namespace |
Your configured namespace (default: frontend) |
timestamp |
Unix timestamp when the report was received |
error.name |
Mapped error name (see table above) |
error.message |
Complete report body as pretty-printed JSON |
tags.report_type |
Original report type for filtering in AppSignal |
tags.report_url |
Direct link to the full report in the Reporting API App |
Example: CSP Violation in AppSignal
Here's how a CSP violation report appears when sent to AppSignal:
{
  "namespace": "frontend",
  "timestamp": 1734012345,
  "error": {
    "name": "CSPViolation",
    "message": "{\n  \"blockedURL\": \"https://evil.com/malicious.js\",\n  \"effectiveDirective\": \"script-src-elem\",\n  \"disposition\": \"enforce\",\n  \"documentURL\": \"https://example.com/checkout\",\n  \"originalPolicy\": \"default-src 'self'; script-src 'self'; report-to default\"\n}"
  },
  "tags": {
    "report_type": "csp-violation",
    "report_url": "https://reporting-api.app/organizations/abc123/reports/456"
  }
}
In AppSignal, this appears as an error named CSPViolation in your frontend namespace. The
report_url tag lets you click through to see the full report details in the Reporting API App.
Troubleshooting
Reports Not Appearing in AppSignal
- Check the integration is enabled — In your application settings, verify the AppSignal integration toggle is on
- Verify your API key — AppSignal's endpoint doesn't validate API keys in real-time (it returns 200 OK regardless). If reports aren't appearing, double-check you copied the correct Front-end error monitoring key
- Check AppSignal's error count — In AppSignal, look at your error counts to confirm reports are being received. If the count isn't increasing, the API key may be incorrect
- Wait a moment — AppSignal may take a few seconds to process and display new errors
Wrong Namespace
- Check your configuration — Edit the AppSignal integration and verify the namespace setting
-
Default is
frontend— If you don't see your configured namespace, reports may be using the default
API Key Security
- Key is encrypted — Your API key is encrypted at rest and never logged. After saving, the UI shows a placeholder instead of the actual key
- Updating the key — To change your API key, enter the new key in the field. Leave it blank to keep the existing key
Next Steps
- Webhooks — Send reports to custom HTTP endpoints
- Google Chat — Get alerts in Google Chat spaces
- CSP Violations — Configure Content Security Policy reporting
Resources
- AppSignal JavaScript documentation — Official AppSignal frontend monitoring docs
- AppSignal errors endpoint API — Technical reference for the errors endpoint